Logs
The Logs page shows every query the profile answered, newest first, when logs are on. It has two tabs:
- Live shows new queries as they arrive.
- Search looks back over a time range.
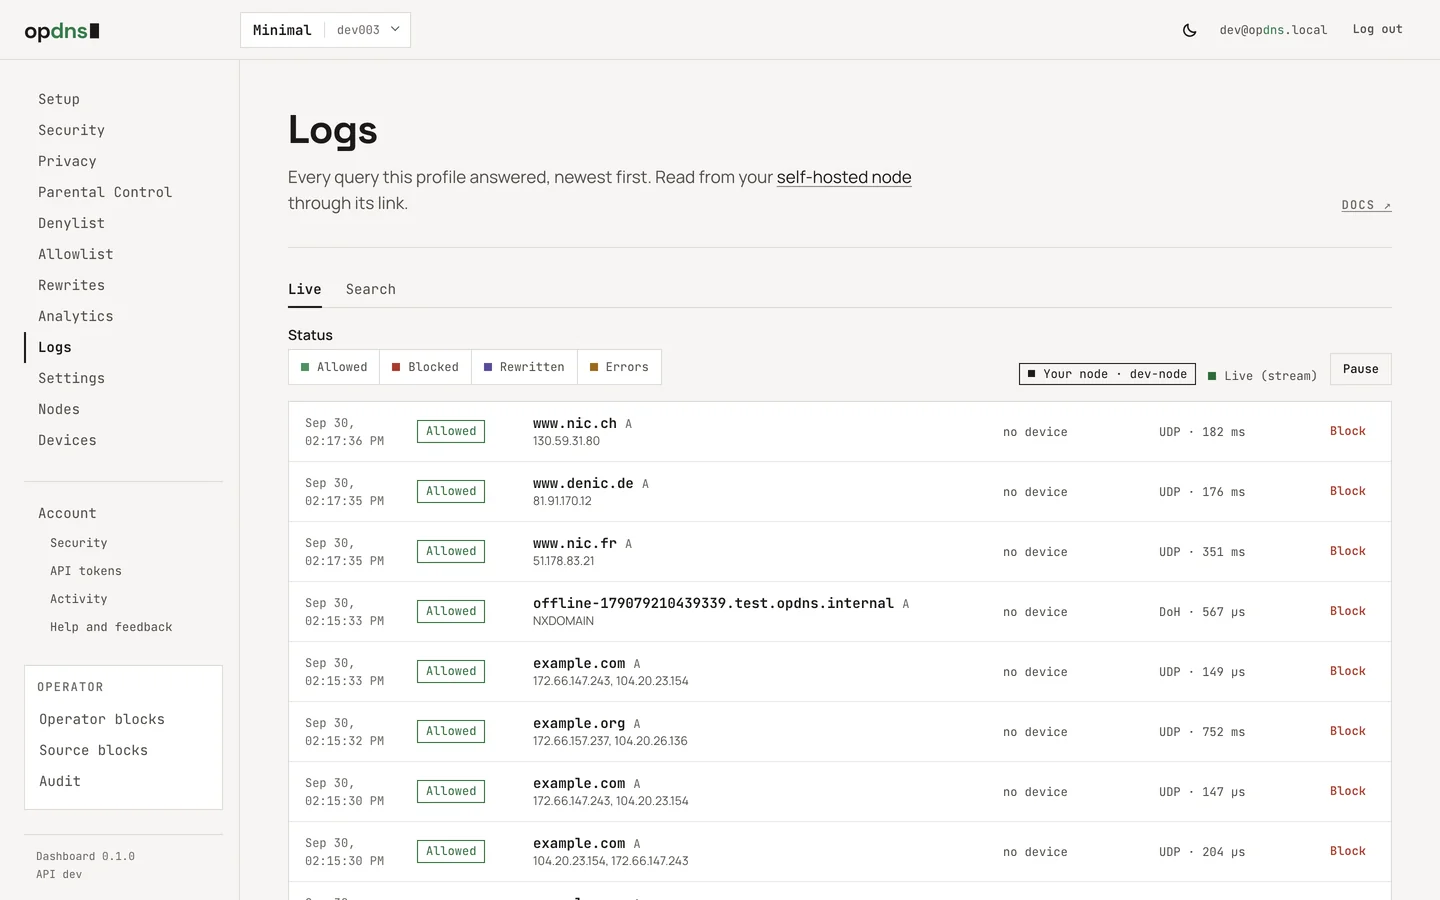
Each row shows the time, the name, the outcome and why (the list or rule), and the device. Select a row for its details.
The live tail starts with the latest queries and adds new ones at the top. Filter it by status (allowed, blocked, rewritten, errors). Pause stops it and Resume carries on from where it stopped, so nothing is skipped. The page keeps the latest 2,000 queries in memory; use Search for older ones.
The indicator next to the buttons says how new queries reach the page:
| Indicator | Means |
|---|---|
| Live (stream) | the dashboard holds a stream open (server-sent events) and new queries are pushed as they are logged |
| Live (polling) | the stream is not available, so the dashboard asks for new queries every 2 seconds instead |
| Connecting | the tail is starting |
| Reconnecting | the connection dropped; the rows already shown stay, and the dashboard reconnects by itself, picking up after the last row it had |
| Paused | you paused it |
| Stopped | an error that retrying cannot fix; the page shows it with a retry button |
The dashboard falls back to polling when the API has no stream or refuses one more: an account can hold 4 streams at once on each API server, and a tab beyond that polls. Both ways show the same rows, without gaps or repeats. On the server, a stream checks the log destination every second, closes after an hour (the dashboard reopens it), and ends as soon as your session is signed out or the profile is deleted.
Search
Section titled “Search”Search filters by time range, status, part of the domain name, and device id. Results come 100 at a time; Load older queries fetches the next page. The API accepts more filters (record type, list, client address) than the page offers.
Where the page reads from
Section titled “Where the page reads from”The page asks the API, which answers from the profile’s log destination:
| Destination | Read from | Badge |
|---|---|---|
| opdns cloud, Both | opdns’s log database | Cloud |
| My self-hosted node | your node, relayed through its link | Your node · name |
| Nowhere | nothing to show | Not stored |
The badge next to the results says which one answered, so you can tell a cloud result from a relayed one; the views are otherwise the same. Relayed results pass through opdns’s servers in transit (TLS on each hop) and are not stored there. See Architecture.
When logs are relayed from your node, the page has states of its own:
| State | What you see |
|---|---|
| Asking your node | after a second without an answer, a note that the request goes through the node’s link and can take a few seconds |
| Node offline | the node’s name and when it was last seen, a countdown to the next automatic retry, Retry now and a link to Nodes. With no node enrolled, it says so |
| Node did not answer in time | the node took longer than 10 seconds; narrow the time range or retry |
| Node too old for this view | update the node, then reload |
In the live tail, a node that goes offline shows as Reconnecting, and the rows already on screen stay until it is back.
With logs off, or the destination set to Nowhere, the page says there is nothing to show and links to Settings. Turning logs on applies from then on, not to past queries.
Query details
Section titled “Query details”Selecting a row opens the query in full:
- a plain answer to Why was this blocked? (or allowed, rewritten, failed), with a link to the setting that decided it;
- Reason: the kind of decision and its code (below);
- List or Rule: the list’s name and id, or your rule’s text;
- EDE: the Extended DNS Error code and text the device received, if any;
- time, device (display name and id), client IP (or not logged), transport and PoP (or self-hosted node), latency and whether it came from cache, response code and DNSSEC validation, and the answer addresses;
- a warning when the name mixes Latin with Greek or Cyrillic letters, a common look-alike trick.
| Reason | Code | EDE the device saw |
|---|---|---|
| Operator block | operator |
15 (Blocked), text legal_order, abuse or csam; see policies |
| Security list | security_list |
17 (Filtered), the list’s name |
| Parental Control | parental_list |
17, the list’s name |
| Blocklist | blocklist |
17, the list’s name |
| Denylist rule | denylist |
17, denylist: <pattern> |
| DNS rebinding protection | rebinding |
17, rebinding: <address> |
| Security or parental setting | filtered |
17; the record does not say which setting |
| Rewrite | rewrite |
none |
| Allowlist rule | allowlist |
none |
| Resolved normally | resolved |
none |
| Upstream error | upstream_error |
the resolver’s, if any |
The API sends each record’s EDE code and text, and a coarser reason code
(list, rule, operator:<code>, rewrite, none; see
Log query results); the
dashboard refines it with the list’s category, so a security list and a
Parental Control list read differently.
A result relayed from a node can be partial: the rows shown are correct but some may be missing. The page then shows a Partial results notice that says why:
| Reason | Means |
|---|---|
time limit (timeout) |
the node answered close to its time limit with what it had; narrow the time range |
reconnecting (node_reconnecting) |
the node’s link to opdns is reconnecting; the missing rows appear once it is back |
busy (overload) |
the node had too many dashboard queries at once and shed this one; try again in a moment |
Analytics shows the same notice on its cards.
Change what happens next time
Section titled “Change what happens next time”The details offer Add to denylist and Add to allowlist for the
name and for its parent domain (b.example.com and example.com), and a
link to every query for the name. Rows in the list have the same quick
actions. A rule for a name also covers its subdomains.
Allowing always asks first. Allowlisted names skip blocklists, security checks and Parental Control’s blocked categories and services (SafeSearch and YouTube restricted mode still apply). When a security list blocked the name, the confirmation names the list and says it considers the name dangerous, and Allow despite list stays disabled until you tick I understand that list will no longer protect this profile from name.
Report a wrong block or a miss
Section titled “Report a wrong block or a miss”Your allowlist fixes a wrong block for your profile at once. A report tells the list maintainers, so the fix can reach everyone who uses the list. Both are offered in a query’s details:
| Query | Button | Reports |
|---|---|---|
| blocked by a catalogue list | Report a wrong block | that the list should not block this name (a false positive) |
| allowed, on a profile with at least one security list on | Report a miss | that a security list should have blocked this harmful name (a false negative) |
Blocks by your own rules, by a setting or by an operator entry have no report button: they are not a list’s doing. The form has the domain filled in (you can edit it, for example to report the parent domain), the list (for a miss, choose which of your security lists should have caught it) and an optional note of up to 500 characters. Send report confirms with Report sent.
An account can send 20 reports a day; beyond that the form says so. Your reports and their outcome are under Settings → Lists → Your reports: the domain and your note, the list (with the list version it was reported against), Wrong block or Miss, the status (Open, Accepted or Rejected) with the maintainers’ note, and the date sent. Reports are per profile; everyone in your organisation sees the profile’s reports.
The maintainers aim to answer within two business days. When they accept or reject your report, you also get an email with the outcome, their note and what happens next.
A report never changes a list by itself. The maintainers review it, and an
accepted one becomes a candidate change that goes through the same review
as any other list change (List reports
describes the operator side). The same is available through the API:
POST and GET /v1/profiles/{id}/list-reports
(List reports).
What a record holds
Section titled “What a record holds”The fields and what each privacy switch removes are listed in the privacy policy, section 4. In short: time, PoP and node, device, client address (unless off), transport, name and type (unless domain logging is off), outcome and reason, response code, DNSSEC status, a cache-hit estimate, latency, and at most the first two answer addresses.
Export and clearing
Section titled “Export and clearing”Download as CSV and clearing logs from this page are in the beta scope (see the comparison) but not in the dashboard yet. The account export includes every profile’s cloud query logs within retention, one JSON object per line. Logs held on a self-hosted node are not in it; they are in the node’s SQLite file.
A device you renamed on the Devices page shows under its display name here.