Analytics
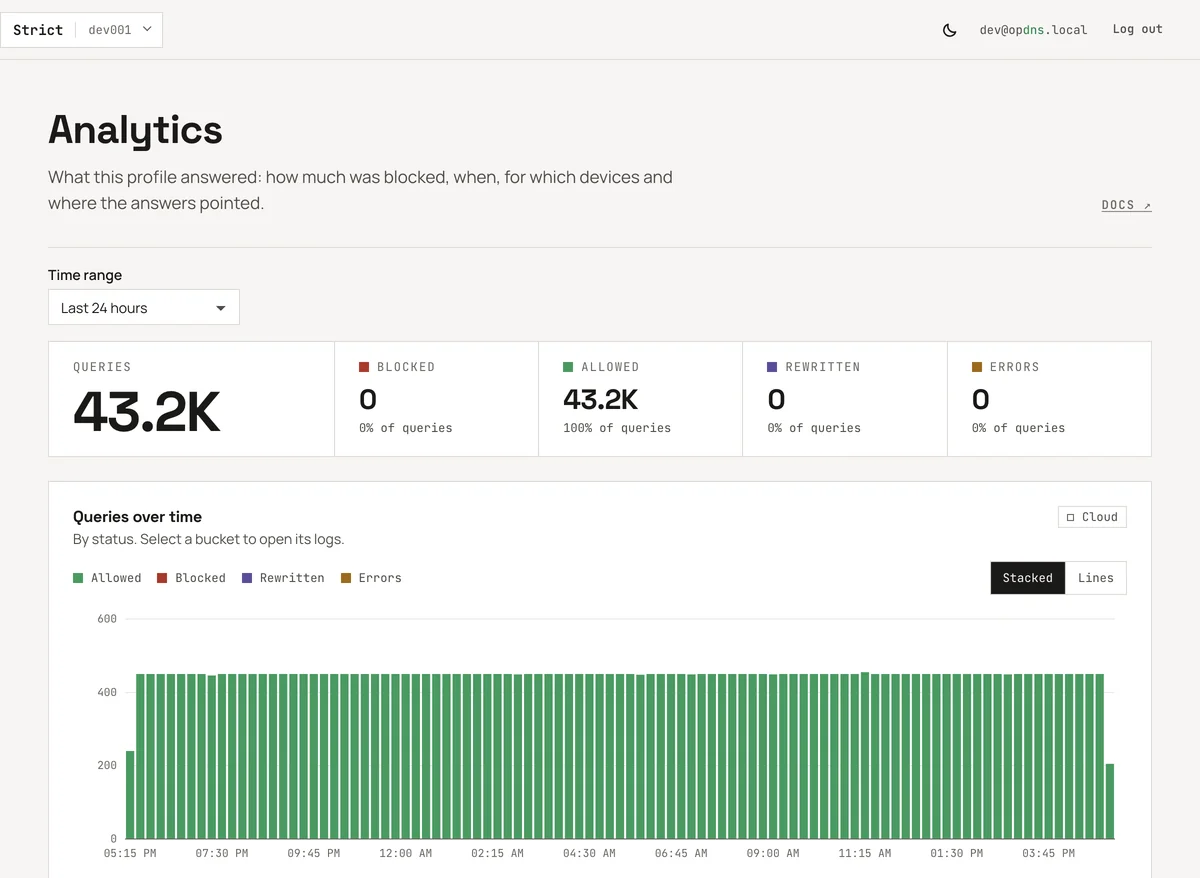
The Analytics page summarises what the profile answered over a time range. Every chart has a legend and a table view, and every entry links to the matching log search.
| Section | Shows |
|---|---|
| Totals | queries by status: allowed, blocked, rewritten, error |
| Queries over time | the same by time bucket; select a bucket to open its logs |
| Top domains | most-queried names |
| Top blocked | most-blocked names, with the list that blocked them |
| Top reasons | why queries were blocked, grouped by reason and list or rule (for example Security list · …, Denylist rule · …, Operator block) |
| Top devices | queries per device name |
| GAFAM | the share of queries that reached Google, Apple, Meta, Amazon or Microsoft, then the big CDNs |
| Destinations | answer addresses of allowed queries: a globe shaded by country, the top countries, and the top networks (IPv4 /24, IPv6 /48) |
| Where your queries were answered | the opdns PoPs that answered the profile’s queries, on a globe and in a table |
Top reasons is counted by the log store over the whole range (the
top_reasons shape of the API): the ten most frequent block and rewrite
reasons. Its entries open the blocked (or rewritten) queries of the range
in Logs. A self-hosted node too old to group by reason says so on the card
and points to Nodes to update it; each query’s reason is still in Logs.
Top devices show a device’s display name when you have set one on the Devices page.
Where each card reads from
Section titled “Where each card reads from”Every card carries the same source badge as Logs: Cloud, Your node · name or Not stored. Cards come from the profile’s log destination: the cloud’s log database, or your node through its link. A card relayed from a node has the same states as Logs (asking your node, node offline with a retry countdown, node timeout), and a node running an older version may not support every view; the card says so.
Totals and Queries over time are the exception when nothing but the time range is set: they come from the cloud’s hourly counters, whatever the destination, so they work with logs off and for the Nowhere and My self-hosted node destinations (their badge then says Cloud). They count the queries the cloud answered, not those your devices send straight to a self-hosted node. Counters cover whole hours. Top lists, reasons and destinations need per-query records, so with logs off or Nowhere they are empty.
Destinations globe
Section titled “Destinations globe”The Destinations card shows where the addresses your allowed queries resolved to are: a dot-matrix globe with each country shaded by its share of the answer addresses, a legend, and a table of the ten countries with most answers (addresses without a known country count as Unknown), above the ten busiest networks. Both are drawn from the range’s 100 most frequent answer addresses. The globe starts centred on the top country.
Countries are shaded in five steps, on a square-root scale so that a few large countries do not flatten the rest: the lightest step is land with no answers, the darkest the busiest countries (in dark mode the ramp runs the other way, light on dark). Point at a country, or step to it with the keyboard, to see its name, its count and its share of every answer address, the unknown ones included; the table uses the same shares.
The globe is drawn in your browser from a world outline the dashboard serves itself (Natural Earth data); nothing is fetched from a map provider.
What it needs:
- A GeoIP database on the server. Countries come from the control plane’s GeoIP lookup of each answer address (GeoIP and owner classification). On a deployment without one every country is unknown: the globe stays unshaded, pointing at a country gives its name only, and the country table is replaced by Countries need a GeoIP database on the server. The networks table still works.
- Per-query records, like the other top lists: logs on, and a destination other than Nowhere.
- Domain logging on. With it off, answer addresses are never recorded, so there is nothing to place.
For a profile whose logs live on your self-hosted node, the node sends the addresses and the control plane adds their countries as the answer passes through; the node itself has no GeoIP data.
The country is where the GeoIP database places the answer address, not where the company behind it is based. Addresses that are not public (private networks, CGNAT, documentation ranges) have no country.
When the database’s licence asks for credit (DB-IP’s does), the notice is shown beside the globe, with its links.
The GAFAM card counts the range’s queries by the company they reached:
Google, Apple, Meta, Amazon and Microsoft, then the CDNs Cloudflare,
Akamai and Fastly, and everything else as Everything else. A query belongs to the
company behind its name (youtube.com is Google’s) or, failing that,
behind its first answer address. The line above the bars gives the share
that went to the five GAFAM companies. It reads the top_owners view of
the API (Log query results),
so it needs per-query records like the other top lists; a self-hosted node
too old for it says so on the card. Its entries do not link to Logs,
which has no company filter.
Where your queries were answered
Section titled “Where your queries were answered”This card shows which opdns points of presence (PoPs) answered the profile’s queries over the range: the same kind of globe, with one brand-green dot per PoP sized by its share of the queries (the busiest one pulses), and a table of the same PoPs by city with their counts. The PoPs on the near side are labelled with their city, count and share. PoPs that answered nothing in the range are drawn faintly, and PoPs that are planned but not serving yet are shown as outlines. The globe starts centred on the busiest PoP. The table is the same information as text, for screen readers and for exact numbers. Your devices normally reach the nearest PoP, so this is also a quick check that anycast sends you where you expect.
Queries your own self-hosted node answered have no place on the globe; they are listed in the key and the table as Your node. A node too old to report this says so on the card, with a link to Nodes to update it.
The card reads the top_pops view of the API and places the PoPs from the
public PoP list, GET /v1/pops
(Log query results). Like
the other top lists it needs per-query records: logs on, and a destination
other than Nowhere.
Using the globes
Section titled “Using the globes”Both globes turn slowly by themselves (once every 80 seconds) and work the same way:
| To | Mouse or trackpad | Touch | Keyboard (globe focused) |
|---|---|---|---|
| turn it | drag | drag with one finger | arrow keys |
| zoom in or out | Ctrl (⌘ on a Mac) + scroll, or pinch on a trackpad, around the pointer; or the + and − buttons under the globe | pinch | + and - |
| go back to the whole globe | Reset under the globe | Reset | 0 |
| name a country or PoP | point at it | read the table beside the globe | Enter (or Space) steps through them, centring each |
| close the tooltip | move away | Escape |
Zoom goes from 1x to 6x; the level shows next to the buttons (for example
3.0×), and each button or key press zooms by √3, so two presses make 3x.
The land stays a dot matrix at every level: the dots get finer as you
zoom in, while dots, borders and labels keep their size on screen.
Scrolling without Ctrl or ⌘ scrolls the page, not the globe, so the globe never traps the page on a phone or a desktop; the hint under it says which key zooms (Drag to turn · ⌘ + scroll to zoom, or pinch to zoom on a touch screen). At 1x a vertical swipe on a phone scrolls the page too; once you have zoomed in, the globe takes every gesture until you reset it.
The globe stops turning while you zoom in past 1.2x, while it has focus, while a tooltip is open and while it is off screen; Reset re-centres it and starts it turning again. With reduce motion set in your operating system it stands still, zooms without animation and nothing pulses.